Quarterly RIA ETF Trends Report Q1 2026
.avif)
.avif)
.avif)
This whitepaper analyzes the U.S. RIA ETF holdings universe quarter over quarter. Findings are derived from AdvizorPro's RIA holdings dataset, covering 5,304 CRDs present in both the Q4 2025 and Q1 2026 snapshots. All RIA-level analyses exclude firms not present in both files to ensure like-for-like comparisons.
Table of Contents
- Introduction
- Executive Summary
- Are RIAs Concentrating or Diversifying ETF Allocations?
- ETF Turnover Trends Among RIAs
- Top 10 Fastest-Growing ETF Issuers Among RIAs
- Top 10 Fastest-Growing ETFs Among RIAs
- Top 10 High-Fee ETFs Gaining RIA allocators
- Top 10 Newly Launched ETFs Gaining RIA Adoption
- Top 10 ETF Categories with the Highest RIA Growth
- Adoption of Thematic ETFs Among RIAs
Introduction
The first quarter of 2026 showed RIAs continuing to expand their ETF usage while becoming more selective about where new allocations go. Advisors added ETFs at a steady pace, turnover remained relatively low, and the fastest-growing ETFs were concentrated in a handful of themes: real assets, defense-oriented industrials, international equity.
Our Q1 2026 analysis draws from 13F filings and the AdvizorPro RIA holdings dataset across 5,304 consistently reporting RIAs present in both the Q4 2025 and Q1 2026 snapshots. Building on the annual edition published earlier this year, this quarterly update focuses on where advisor demand is moving inside a single quarter and what it means for issuers competing for new shelf placement.
Executive Summary
Compared with the 2025 annual report, which traced RIAs actively repositioning portfolios amid rate uncertainty and rapid product expansion, this quarter's data confirms the ETF market is settling into a more mature, deliberate phase. Advisors continue to add funds and explore new strategies, but allocations are increasingly defined by portfolio role rather than experimentation, and growth is concentrated in differentiated, outcome-oriented, and real-asset exposures.
Several themes stand out across the data:
- ETF usage continues to broaden across RIA portfolios. The average number of ETFs per firm rose from 85.9 to 89.7 quarter-over-quarter, with 50.1% of RIAs expanding their lineup against 28.9% trimming. RIAs are still net-adding ETFs as the primary implementation vehicle for advisor portfolios.
- Portfolio activity remained elevated, with new placement outpacing displacement. The average quarterly turnover ratio was 12.3%, running above the pace implied by the 2025 annual report's full-year rate. Adds outpaced drops 13.7% to 9.2%, producing a net gain of over 20,000 ETF positions across the universe.
- Issuer competition is shifting from entry to share expansion. The top 10 incumbents (iShares, State Street, Vanguard, Invesco, Schwab ETFs, VanEck, First Trust, Dimensional, JPMorgan, WisdomTree) remain deeply embedded with flat-to-modest QoQ moves, while the fastest-growing issuers are active and specialty shops - Akre Capital Management (+188.6%), Cohen & Steers (+35.3%), MFS (+33.8%), First Eagle (+33.3%), USCF (+31.6%), REX Shares (+31.6%), and Cambria (+27.0%) are all gaining share with differentiated strategies.
- Real assets and international equity ETFs led category growth this quarter. Equity Energy, Natural Resources, and Commodities Broad Basket combined for 528 net new RIAs, leading all categories.
- Advisors continue to pay a premium for strategies that serve a specific risk management or income role. The high-fee gainers list this quarter spans long-short equity, credit-hedged income, preferred and MLP infrastructure, and option-overlay strategies. The composition shifted from the 2025 annual report, where defined outcome and buffered products dominated, suggesting advisor willingness to pay for complexity is broadening. Several newly launched derivative-income and defined outcome funds also entered the new launch leaderboard.
Taken together, the findings point to an ETF market that is still expanding. RIAs are no longer just increasing ETF usage; they are refining how ETFs are used, selecting funds more intentionally, and integrating them as core building blocks of portfolio construction.
1. Concentration Trends
This analysis examines whether RIAs are concentrating into fewer ETF positions or broadening exposure across more strategies. Drawing from 5,304 RIAs present in both the Q4 2025 and Q1 2026 snapshots, we track firm-level ETF counts quarter over quarter to assess whether advisors are consolidating or diversifying their lineups. The data points clearly that the average number of unique ETFs per firm rose from 85.9 to 89.7, expanders outnumbered contractors nearly 2-to-1, and 21% held steady, RIA ETF portfolios are broadening, not contracting.
.webp)
Key Takeaways
- RIA portfolios continue to broaden, not consolidate. The average number of unique ETFs per firm rose from 85.9 to 89.7 QoQ, consistent with the full-year 2025 trend where average ETF count climbed 13.7% annually. The direction hasn't changed — but the pace is moderating, signaling a maturing market rather than a reversal.
- Expanders still outnumber contractors nearly 2-to-1. Half of all RIAs added ETFs this quarter versus 29% that trimmed, a ratio that mirrors the lopsided expansion seen throughout 2025. The ETF adoption story remains intact even as growth shifts from rapid expansion to steady accumulation.
- The broadening trend favors differentiated products over core replacements. With advisors incrementally adding slots rather than overhauling lineups, the opportunity for issuers is in filling specific portfolio roles — income generation, downside protection, thematic exposure — not displacing incumbents.
- Stability in the "no change" cohort points to lineup maturation. 21% of RIAs held their ETF count flat, a sign that a meaningful portion of the market has reached a stable configuration. For issuers, winning new allocators increasingly means earning a defined role, not just getting on a shelf.
2. ETF Turnover Trends
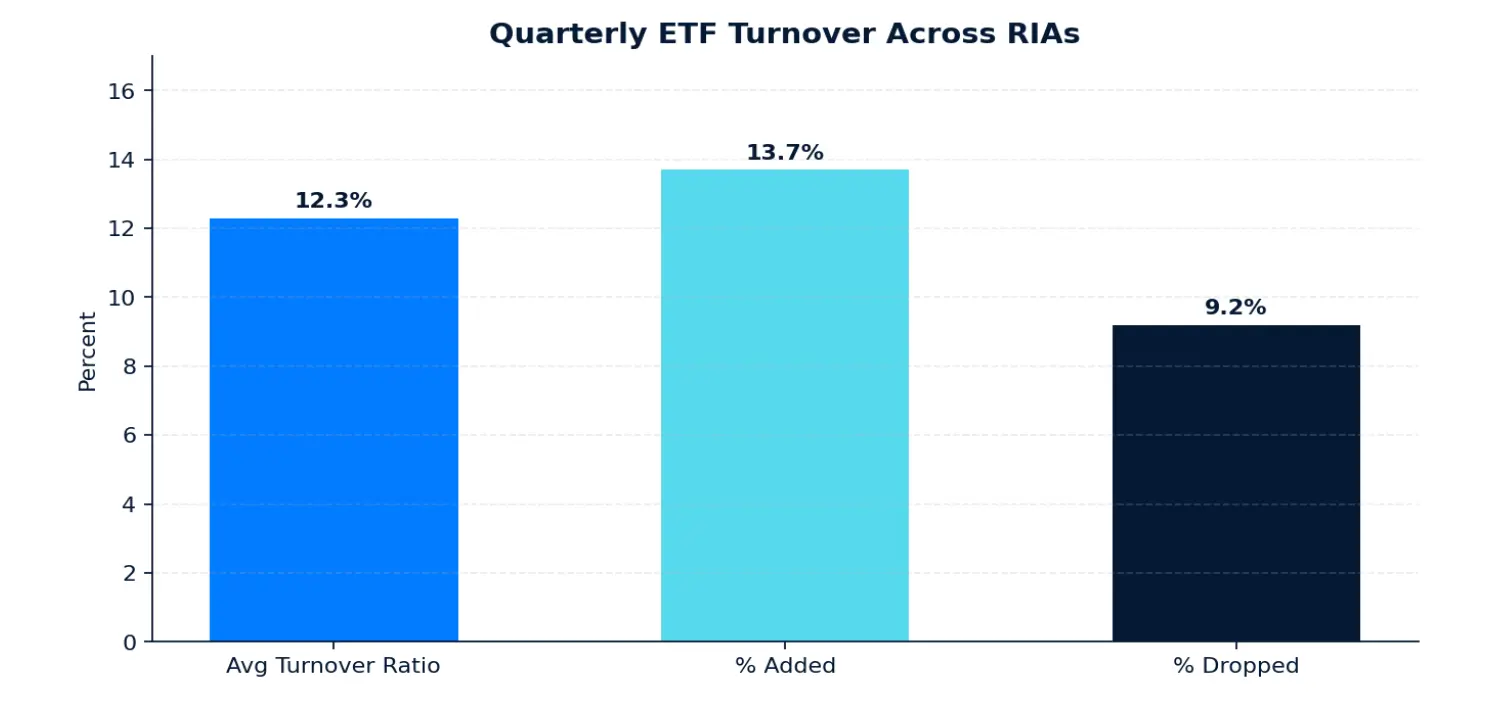
This analysis measures how actively RIAs reshuffled their ETF positions from Q4 2025 to Q1 2026, capturing both the pace and direction of portfolio change. Turnover ratio is defined as (ETFs added + ETFs dropped) / 2 divided by average holdings, averaged across all 5,304 RIAs present in both quarters. At 12.3% average turnover, with adds running at 13.7% of prior holdings versus drops at 9.2%, the data reflects orderly rebalancing rather than broad rotation - and reinforces the broadening trend identified in Section 1.
Key Takeaways
- Quarterly turnover of 12.3% reflects a meaningful level of portfolio activity. Across 5,304 RIAs, advisors added 62,302 ETF positions and dropped 41,858 in a single quarter, a net gain of over 20,000 positions.
- Adds outpaced drops by roughly 1.5x, making the direction of turnover constructive for issuers. The 13.7% add rate versus 9.2% drop rate means new slots are opening faster than existing ones are closing. For issuers, the competitive question is less about defending against displacement and more about earning the new positions being created.
- Existing positions are stickier than the overall turnover rate suggests. With 9.2% of holdings dropped, roughly 90% of positions were retained quarter over quarter. For incumbents already in RIA portfolios, the retention environment remains favorable. For challengers, winning new relationships requires a clear differentiation story rather than displacing an existing holding.
- The 2025 annual report showed 36.3% full-year turnover, putting this quarter's rate above that annualized pace. Rather than signaling stabilization, Q1 2026 turnover suggests advisor portfolios remain in active evolution. The constructive signal is not the rate itself but the consistent surplus of adds over drops.
Methodology: For each CRD present in both files, ETFs Added = unique tickers in Q1 not in Q4; ETFs Dropped = unique tickers in Q4 not in Q1; Turnover Ratio = (Added + Dropped) / 2 ÷ ((Q4 holdings + Q1 holdings) / 2). All percentages are averaged across CRDs. CRDs not present in both files are excluded.
3. Top 10 Biggest Issuers — RIA Penetration
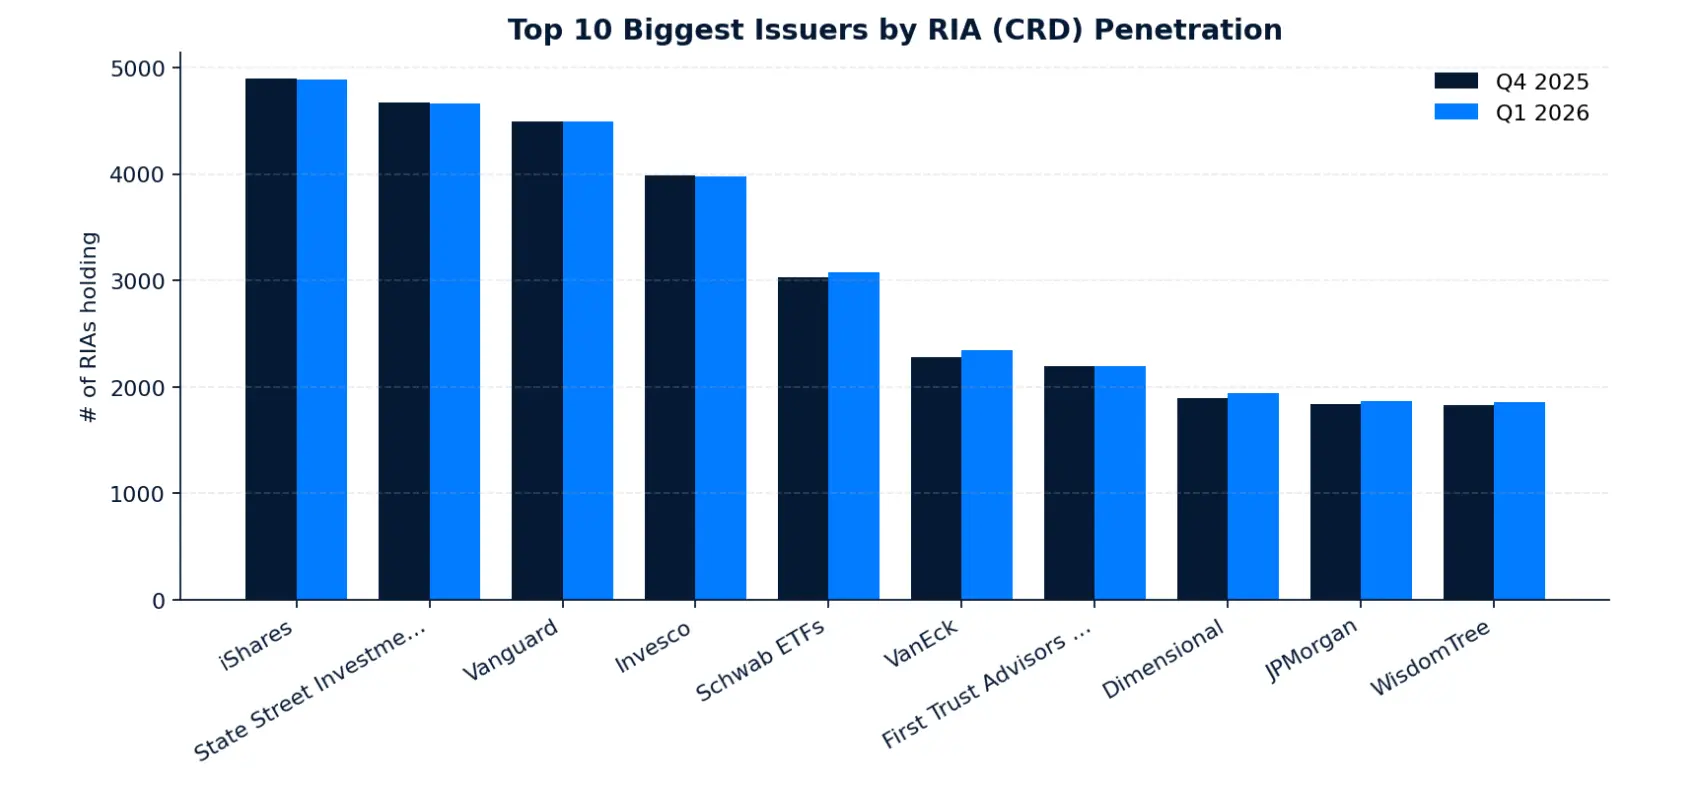
This analysis ranks the largest ETF issuers by the unique number of RIAs holding any ETF from the issuer in Q1 2026. The filter includes all issuers with meaningful RIA penetration, giving a complete picture of where advisor relationships are concentrated and where they are shifting. iShares, State Street, Vanguard, and Invesco remain the dominant gatekeepers, while Schwab, VanEck, Dimensional, JPMorgan, and WisdomTree each added net RIAs, making the mid-tier the quarter's most active competitive battleground.
By RIA Penetration
Key Takeaways
- The largest issuers are holding share. iShares, State Street, and Invesco each posted slight CRD declines this quarter, while Vanguard was essentially flat. At the top of the market, incumbency is the story, not expansion.
- Growth within the top 10 is coming from the mid-tier. VanEck and Dimensional led the group with 2.5% CRD growth each, adding 58 and 47 net new RIAs respectively. Schwab, JPMorgan, and WisdomTree also gained ground. Differentiated strategies continue to drive adoption momentum, a trend consistent with what the 2025 annual report identified throughout last year.
- The competitive band at the top is extremely tight. Net CRD changes across all 10 issuers range from just -0.2% to +2.5%. The largest providers are in a retention battle, not an expansion one.
- For challengers, the mid-tier is where share is actually moving. With the top four issuers essentially locked in place, the action this quarter is among issuers ranked 5 through 10, where net gains are modest but real and compounding quarter over quarter.
4. Top 10 Fastest-Growing ETF Issuers
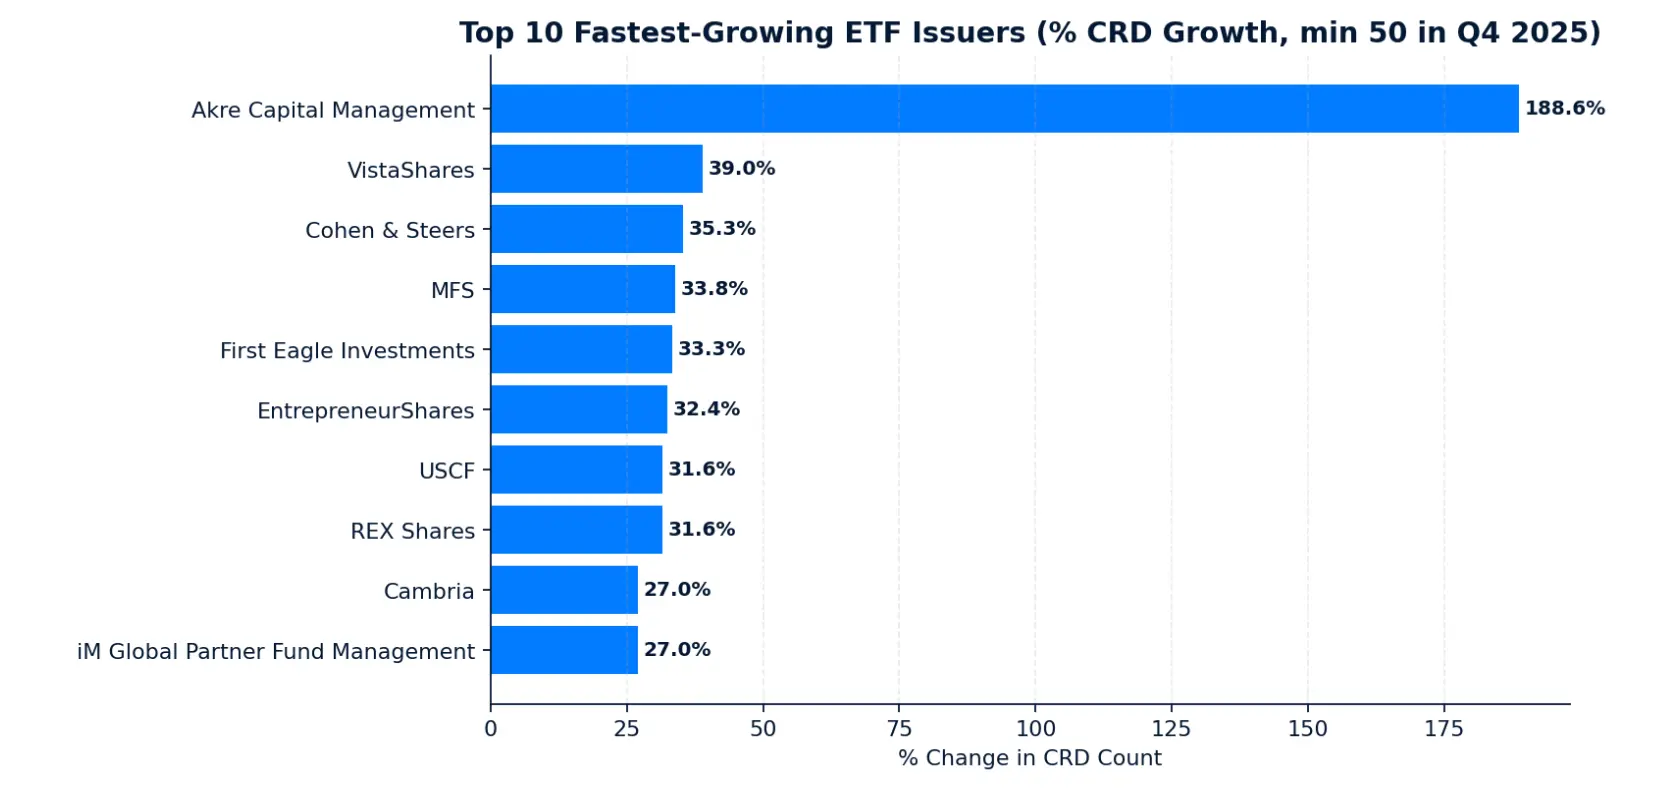
This analysis highlights the ETF issuers experiencing the strongest percentage growth in RIA adoption from Q4 2025 to Q1 2026, filtered to issuers with at least 50 RIAs in Q4 2025 to remove small-base noise. Rankings are based on quarter-over-quarter percentage change in unique RIA count. Akre Capital Management leads by a wide margin at +188.6%, while nine other issuers spanning active equity, thematic, commodity, and option-overlay strategies each added 27% or more RIAs in a single quarter.
Key Takeaways
- Akre Capital's 188.6% surge is a standout. Growing from 140 to 404 RIAs in a single quarter reflects a brand-credible active manager entering the ETF wrapper.
- Outside Akre, the fastest growers cluster tightly between 27% and 39%. That compression signals broad-based momentum among mid-tier issuers rather than a single breakout story. Eight of the top 10 are smaller specialty shops, and all of them are growing at a rate the largest issuers have not approached in years.
- Active and quality-focused managers are gaining real traction in the RIA channel. Cohen and Steers, MFS, First Eagle, Cambria, and iM Global Partner all posted 27% or better CRD growth this quarter. The 2025 annual report flagged differentiated strategies as the primary driver of issuer momentum, and this quarter's list is a direct extension of that trend.
- Thematic and option-overlay specialists are winning new advisor relationships. VistaShares, EntrepreneurShares, USCF, and REX Shares each grew 30% or more, reflecting continued advisor appetite for niche exposures and structured income tools that larger issuers are not offering at the same level of specialization.
- The fastest-growing issuer list turns over almost entirely from 2025. Compared to the 2025 annual report's top growers, the two lists share virtually no overlap. Advisor adoption momentum remains episodic and issuer-specific rather than compounding around a stable group of challengers, meaning no mid-tier issuer has yet built a durable growth advantage in the RIA channel.
5. Top 10 Fastest-Growing ETFs
This analysis ranks the top 10 ETF tickers by percentage growth in unique RIA count from Q4 2025 to Q1 2026, filtered to funds with at least 50 RIA allocators in Q4 2025 to ensure a meaningful baseline.

ETF Growth by RIA Size Bucket (Top 20 Growth ETFs)
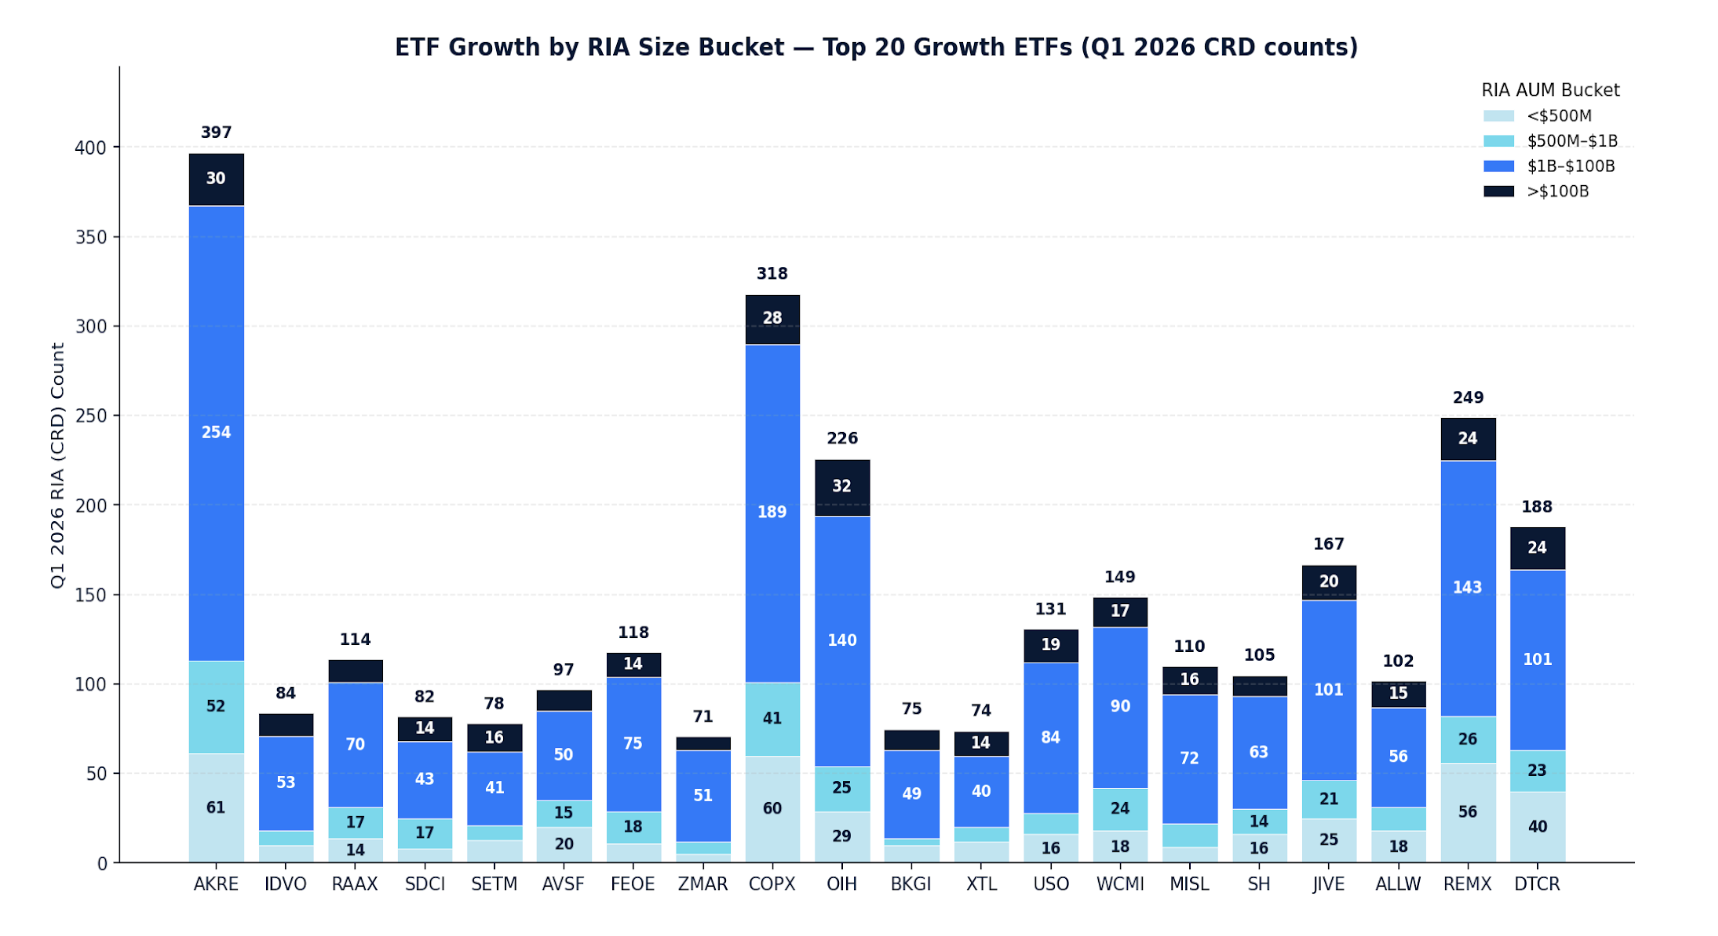
For the same top-20 growth ETFs (extended to 20 tickers), CRD counts are bucketed by total RIA AUM into <$500M, $500M–$1B, $1B–$100B, and >$100B. Adoption is concentrated in the $1B–$100B mid-market RIA segment for nearly every ticker, the most influential cohort for issuer share growth.
Key Takeaways
- AKRE is the standout, but the story behind it matters. A 188.6% CRD surge in a single quarter for a fund less than a year old reflects pent-up advisor demand for a brand-credible active manager finally available in ETF form. It is a one-time adoption event, not a distribution blueprint.
- Real assets and natural resources are having a meaningful quarter. SDCI, SETM, COPX, OIH, and RAAX all posted 44% to 63% CRD growth, reflecting renewed advisor conviction in commodities and energy as inflation and rate uncertainty persist. The 2025 annual report showed commodities-focused ETFs as the top category by absolute RIA growth for the full year, and that trend is accelerating into Q1 2026.
- Income and structured outcome strategies continue to compound adoption. IDVO, RAAX, AVSF, and ZMAR all gained meaningful ground this quarter. This mirrors the 2025 annual report pattern where derivative income and defined outcome ETFs dominated the high-fee adoption list, suggesting advisors have moved past experimenting with these structures and are now systematically adding them.
- Mid-sized RIAs are the primary adoption engine across nearly every ticker. The $1B to $100B AUM segment drives the majority of new CRD counts for almost every ETF on the list. For issuers prioritizing field sales coverage, this cohort is where distribution effort has the highest return.
6. Top 10 High-Fee ETFs Gaining RIA Allocators
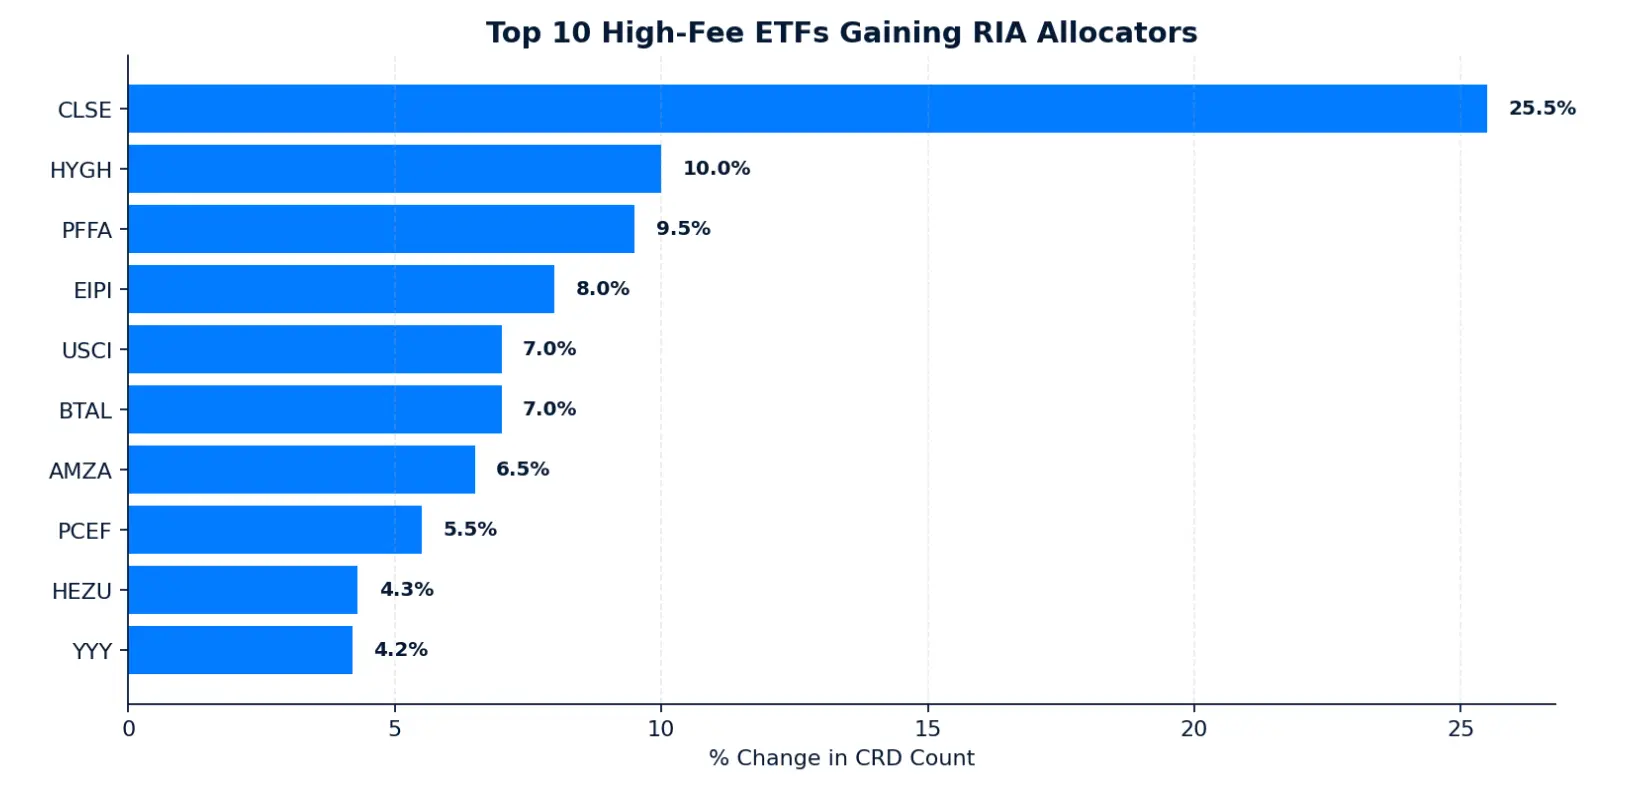
This analysis identifies where RIAs are willingly paying premium fees, restricted to ETFs with expense ratios in the top decile of the Q4 2025 universe and at least 50 RIA allocators in Q4 2025.
Key Takeaways
- Advisors are paying premium fees for risk management, not just yield. CLSE, BTAL, PCEF, and YYY all gained RIAs this quarter despite top decile expense ratios, reflecting willingness to pay for long-short, market-neutral, and hedged income strategies in a volatile macro environment.
- Infrastructure and real asset income strategies are quietly building RIA adoption. Infrastructure Capital Advisors placed two funds in the top 10, with PFFA and AMZA each gaining net new RIAs. Combined with USCI and HEZU, real asset and income-oriented themes dominate the high-fee gainers list this quarter.
- The composition of this list has shifted meaningfully from the 2025 annual report. Last year's high-fee leaders were overwhelmingly defined outcome and options-based funds from First Trust and Innovator. This quarter the list broadens to include long-short equity, credit-hedged income, and infrastructure, suggesting advisor willingness to pay for complexity is expanding beyond buffered products.
- Derivative-overlay strategies continue to hold ground. EIPI, BTAL, PCEF, and YYY all added net RIAs, confirming that option-overlay and structured income tools remain in active demand even as the category faces more competition from new entrants.
7. Top 10 Newly Launched ETFs Gaining Adoption
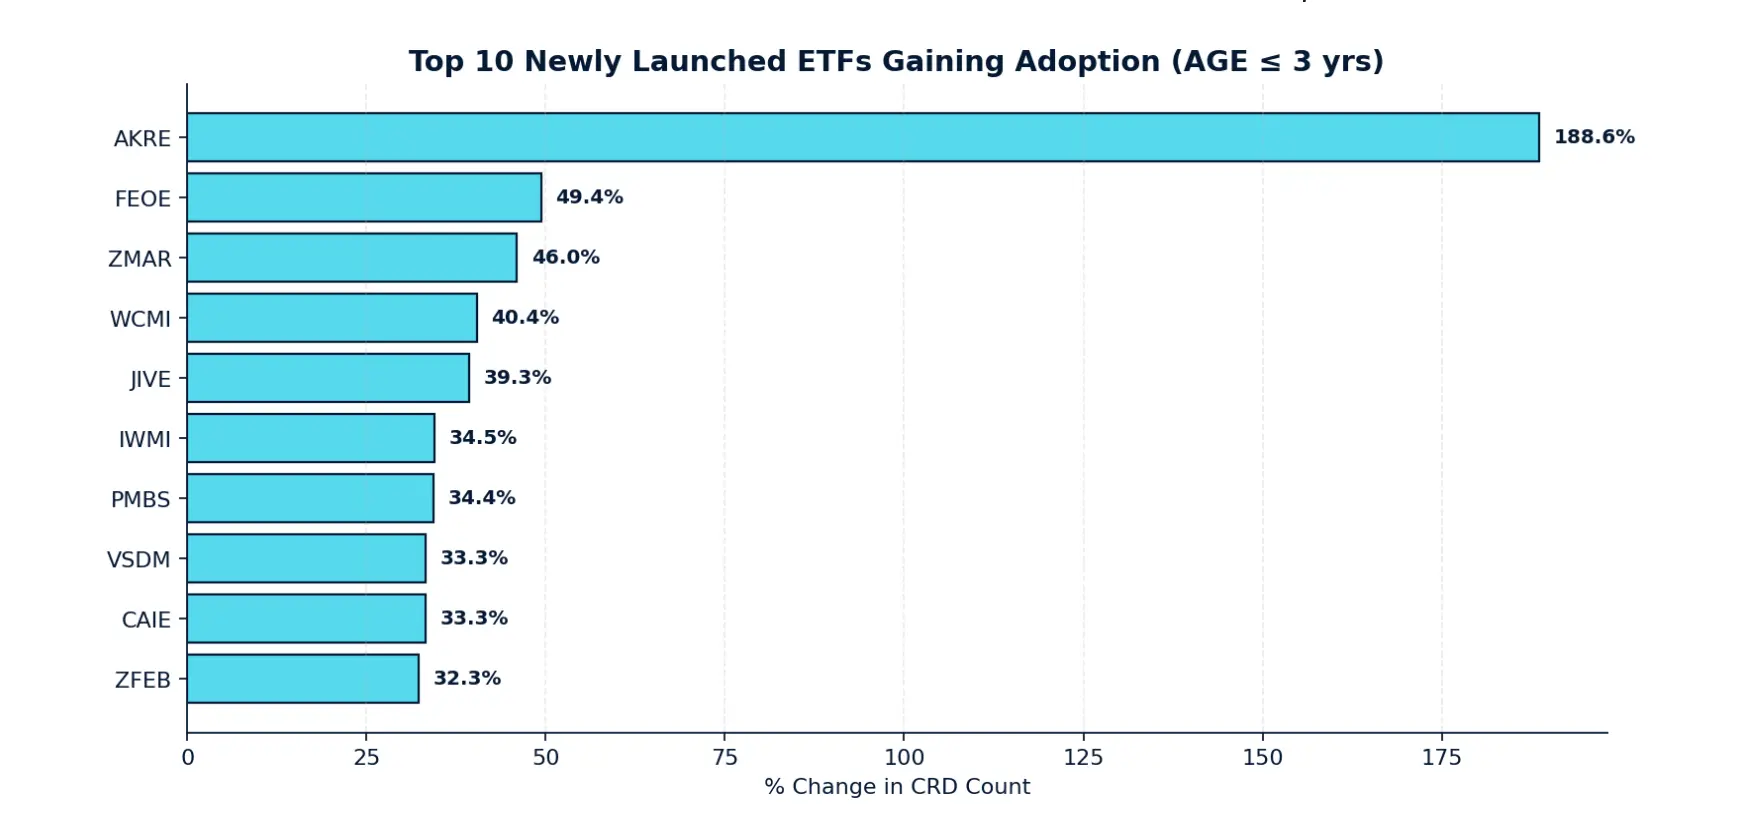
This analysis identifies which recently launched ETFs are gaining the fastest traction with RIAs, filtered to funds three years old or less as of Q1 2026 quarter-end with at least 50 RIA allocators in Q4 2025. For issuer product teams, early RIA adoption is the clearest signal of product-market fit in the advisor channel.
Key Takeaways
- International equity is emerging as a meaningful theme among new launches. FEOE, WCMI, and JIVE all gained 39% or more in RIA adoption this quarter, spanning foreign large blend, foreign large growth, and foreign large value. This is a notable shift from the 2025 annual report's new launch leaders, which were dominated by derivative income and defined outcome strategies.
- Defined outcome and derivative income remain consistent on-ramps for new products. ZMAR, ZFEB, IWMI, and CAIE all gained meaningful RIA adoption despite being relatively new, confirming that structured payoff profiles continue to be among the fastest paths to advisor adoption for new launches.
- New ETFs are reaching scale faster than historical norms suggest. Several funds under 18 months old already exceed 70 to 130 RIA allocators, with AKRE crossing 400. This continues the trend noted in our 2025 annual report that new launches could reach meaningful penetration quickly when aligned with portfolio needs, and this quarter reinforces that adoption timelines are compressing.
8. New ETFs Appearing in Q1 2026 for the First Time
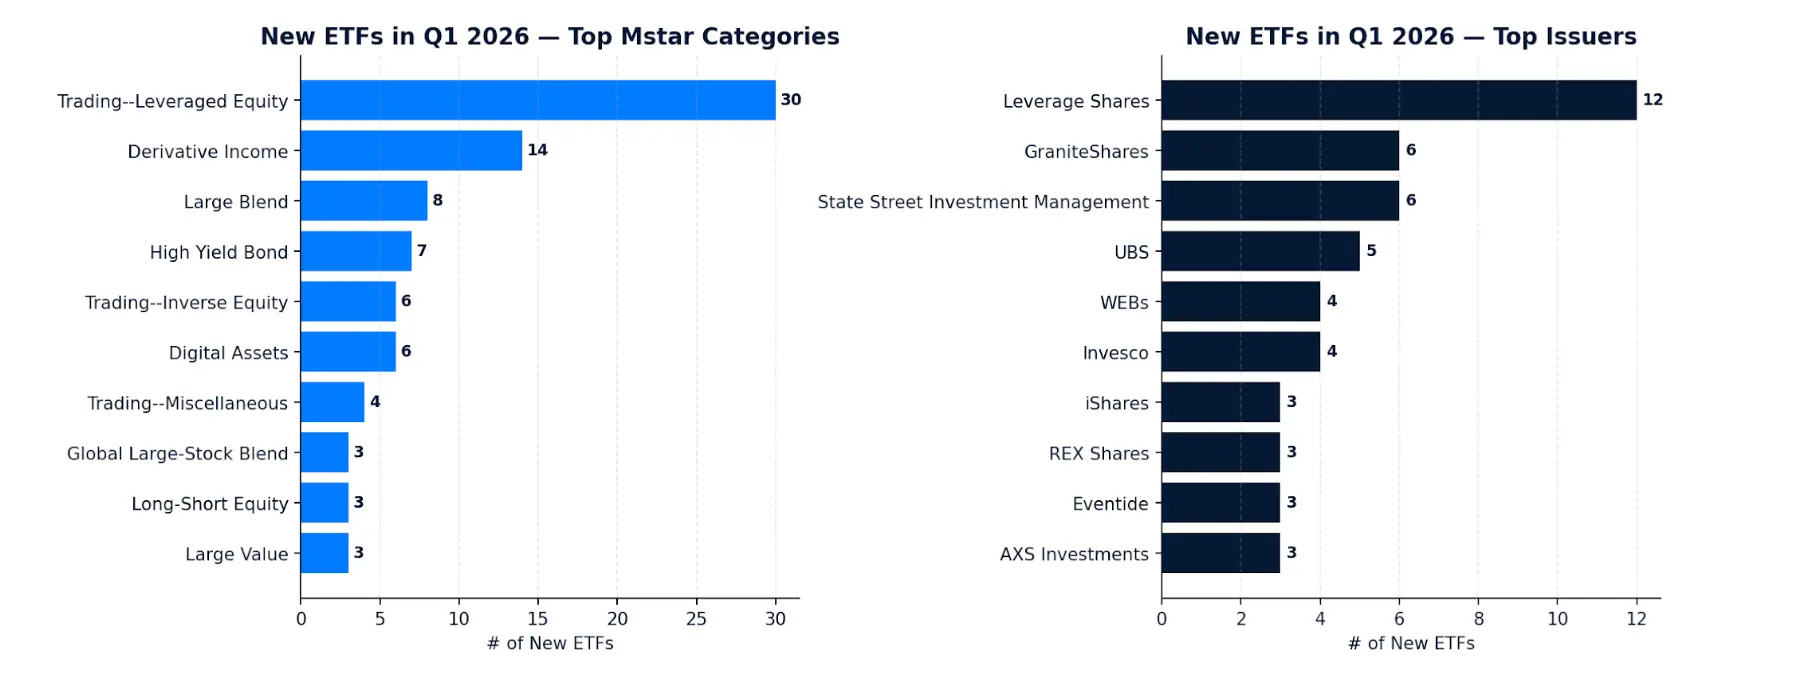
This analysis captures the 140 unique ETF tickers that appeared in RIA portfolios for the first time in Q1 2026, having no presence in the Q4 2025 dataset. These first-touch adoptions offer a real-time read on which new product categories are finding immediate shelf placement with advisors.
Key Takeaways
- Leveraged and inverse products dominate new launch activity. Trading-Leveraged Equity accounted for 30 of 140 new tickers this quarter, and combined with Trading-Inverse Equity represents more than a quarter of all new entrants. This is a sharper skew toward tactical trading products than the 2025 annual report showed, where defined outcome and derivative income led new category entries.
- Yield-oriented launches remain a consistent product development priority. Derivative Income and High Yield Bond together contributed 21 new tickers, reflecting sustained issuer conviction that advisor demand for income solutions has not peaked despite two years of heavy product supply in the category.
- The new launch market is fragmenting across more issuers. Leverage Shares led with 12 new tickers but the remainder of the top issuer list clusters tightly between 3 and 6, with large incumbents like State Street and UBS competing alongside pure-play specialists like GraniteShares and WEBs. Product innovation is widening, not consolidating.
- Large Blend appearing as the third most common new category is a quiet signal. Eight new large blend tickers entered RIA portfolios for the first time this quarter, suggesting issuers are still attempting to compete in core equity despite the dominance of incumbents like Vanguard and iShares in that space.
9. Top 10 ETF Categories by RIA Growth
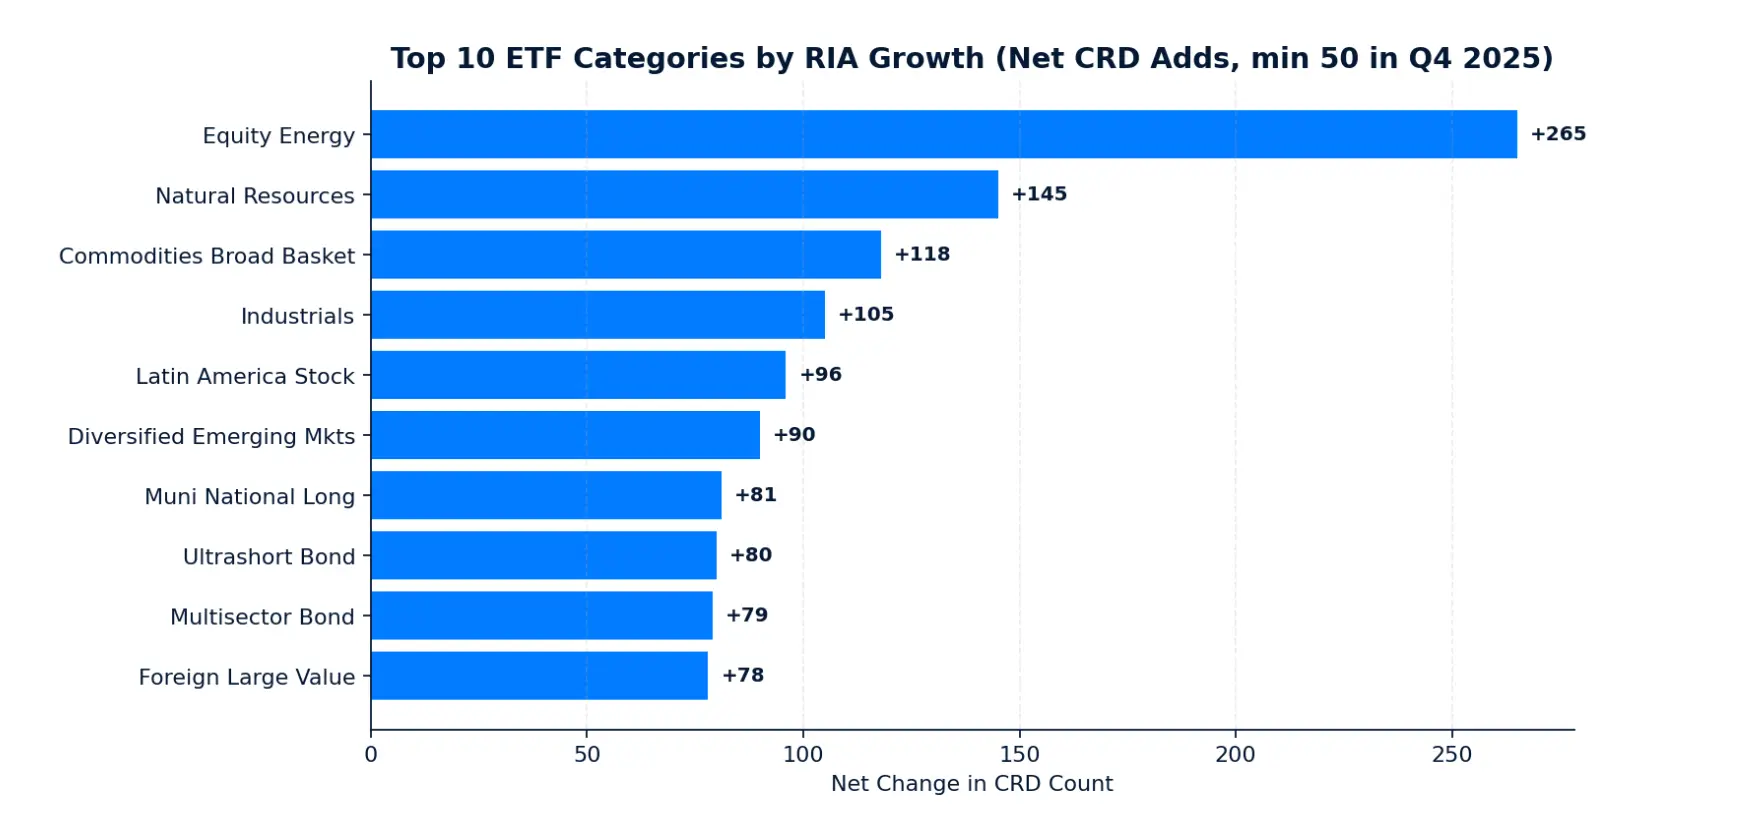
This analysis ranks Morningstar categories by net change in unique RIAs holding any ETF in the category from Q4 2025 to Q1 2026, filtered to categories with at least 50 RIAs in Q4 2025 to exclude small-base noise. The results reflect new advisor adoption of categories rather than larger allocations from existing holders.
Key Takeaways
- Real assets dominated category growth this quarter by a wide margin. Equity Energy, Natural Resources, and Commodities Broad Basket added a combined 528 net new RIAs, leading all categories. This accelerates a trend from the 2025 annual report where commodities-focused ETFs led annual RIA growth, suggesting real asset allocation is becoming a durable portfolio fixture rather than a tactical trade.
- International and emerging market categories are gaining meaningful ground. Latin America Stock grew 24.2% and Diversified Emerging Markets added 90 net RIAs, joining Foreign Large Value in the top 10. Combined with the international equity theme in Section 7, this points to a broader rotation away from U.S.-centric allocations that was less visible in last year's data.
- Fixed income breadth is expanding across multiple strategies simultaneously. Muni National Long, Ultrashort Bond, and Multisector Bond all added 79 or more net RIAs this quarter, spanning tax-aware, short-duration, and diversified credit strategies. Advisors are not concentrating fixed income exposure in a single approach.
- Of 107 qualifying categories, 83 saw positive net RIA growth. That 78% positive rate signals broad-based expansion rather than rotation concentrated in a few themes. For issuers, the rising tide is real this quarter, but the categories with the strongest absolute gains are where distribution investment will have the clearest return.
10. Thematic ETF Trends
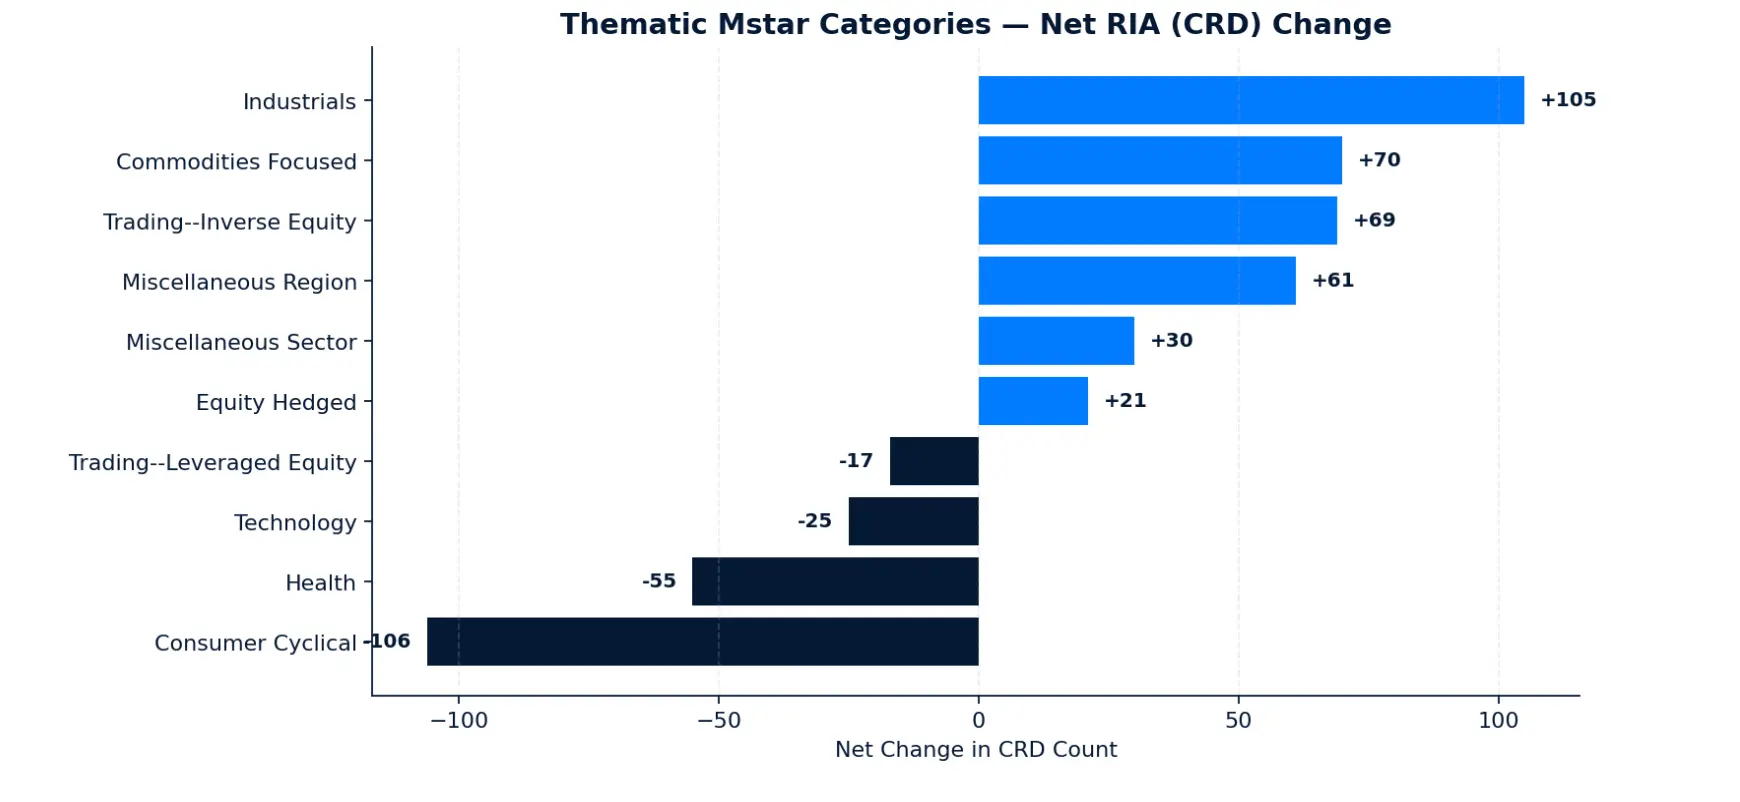
This analysis tracks RIA adoption trends across eleven thematic Morningstar categories: Technology, Digital Assets, Industrials, Consumer Cyclical, Health, Equity Hedged, Miscellaneous Sector, Miscellaneous Region, Commodities Focused, Trading Leveraged Equity, and Trading Inverse Equity. Each ranking is filtered to categories with at least 20 RIAs in Q4 2025 and uses only firms present in both quarterly snapshots for a clean like-for-like comparison.
Key Takeaways
- Defense ETFs were a driver of iindustrial thematic growth this quarter. SHLD, XAR, and PPA collectively added over 200 net RIAs, pointing to advisor conviction around defense spending. Real asset tickers GLD, IAU, and USO moved alongside them, consistent with a macro environment marked by geopolitical uncertainty and inflation hedging.
- Tactical hedging is gaining ground as a structural allocation. Trading-Inverse Equity surged 27.1%, adding 69 net RIAs alongside modest Equity Hedged gains. Advisors appear to be building hedge sleeves as a deliberate portfolio component.
- Technology lost RIAs as a category while individual tickers gained significantly. The category shed a modest 25 net RIAs overall, yet IGV gained 108 and SMH gained 65. Advisors are concentrating within technology around specific semiconductor and software exposures rather than holding broad tech, a more selective posture than the 2025 annual report's broad tech adoption trend.
Executive Key Takeaways for ETF Issuers
- RIA portfolios continued to broaden, not consolidate. The average number of ETFs per firm rose from 85.9 to 89.7, with 50.1% of RIAs adding net new ETFs and expanders outnumbering contractors nearly 2-to-1. Turnover remained orderly at 12.3%, with adds outpacing drops by a 1.5x margin, confirming that advisors are layering in new strategies rather than rotating out of existing ones.
- Real assets dominated category and thematic growth by a wide margin. Equity Energy, Natural Resources, and Commodities Broad Basket added a combined 528 net new RIAs, leading all categories. Defense and aerospace ETFs drove industrial thematic gains, with SHLD, XAR, and PPA collectively adding over 200 net RIAs. Gold and oil moved alongside them, consistent with a macro environment shaped by geopolitical uncertainty and persistent inflation hedging.
- Active managers entering the ETF wrapper are capturing RIA attention fast. Akre Capital Management grew from 140 to 404 RIAs in a single quarter, the clearest case study yet of a brand-credible active manager converting long-tenured strategy followers into ETF allocators. Beyond Akre, Cohen and Steers, MFS, First Eagle, Cambria, and iM Global Partner each posted 27% or better RIA growth, signaling broad momentum for active and quality-focused strategies in ETF form.
- International equity emerged as a new theme among fast-growing funds. FEOE, WCMI, and JIVE each gained 39% or more in RIA adoption, spanning foreign large blend, growth, and value. This marks a meaningful shift from prior quarters where derivative income and defined outcome strategies dominated new launch adoption, and aligns with broader category data showing Latin America Stock and Diversified Emerging Markets among the quarter's strongest gainers.
- Fee tolerance is expanding beyond buffered products into risk management strategies. The high-fee gainers list shifted away from the defined outcome and options-based funds that dominated in 2025 toward long-short equity, credit-hedged income, and infrastructure strategies. Advisors are paying premium fees for portfolio engineering functions including downside protection, hedged income, and volatility management, not just yield.
- The fastest-growing issuer and ETF lists rotate almost entirely quarter to quarter. Virtually none of the top growers from the 2025 annual report reappeared on this quarter's lists. Advisor adoption momentum remains episodic and issuer-specific, with no mid-tier issuer yet building a durable growth advantage in the RIA channel.
Bottom Line
Q1 2026 was defined by conviction around real assets and defense, accelerating adoption of active ETF strategies, and continued broadening of RIA portfolios across more funds, more issuers, and more categories. The issuers seeing the strongest results are those offering a clear portfolio role, whether that is income engineering, thematic exposure, or risk management, rather than competing on scale alone.
Sources: AdvizorPro Q4 2025 & Q1 2026 RIA ETF holdings dataset (corrected Q1 file). Industry-trend framing references widely reported 2025–2026 themes including AI infrastructure capex, defense rearmament, real-asset rotation, model-portfolio broadening, and the rate-cutting environment.
About AdvizorPro
AdvizorPro is the advisor intelligence platform built for asset managers, ETF issuers, wealthtechs, and distribution teams that need to identify, prioritize, and engage financial advisors. With verified data across 750,000+ RIAs, family offices, and broker-dealers - combined with AI-powered lead scoring, TrafficIQ visitor intelligence, native CRM integrations, and now direct connectivity to Claude and ChatGPT - AdvizorPro powers the go-to-market strategies of leading firms across the wealth management ecosystem.
Ready to accelerate your advisor distribution strategy? Book a quick demo

Cole Cummings is the Director of Marketing at AdvizorPro and a B2B SaaS marketer with multiple years of experience in the fintech industry. He leads all of AdvizorPro’s data-driven research and industry reports, giving him deep expertise in the RIA ecosystem and the trends shaping advisor behavior, allocation decisions, and firm growth across wealth management.
Related Post
Related insights you may find valuable