Private Equity Ownership in the RIA Space – 2025 Trends
.avif)
.avif)
.avif)
Private equity (PE) continues to reshape the Registered Investment Adviser (RIA) landscape. This report presents a data-driven analysis of that in 2025, drawing on proprietary AdvizorPro research with a focus on year-over-year comparisons between July 2024 and July 2025.
Key Findings
- PE-backed RIA count rose 16% year-over-year, from 255 firms in July 2024 to 295 in July 2025.
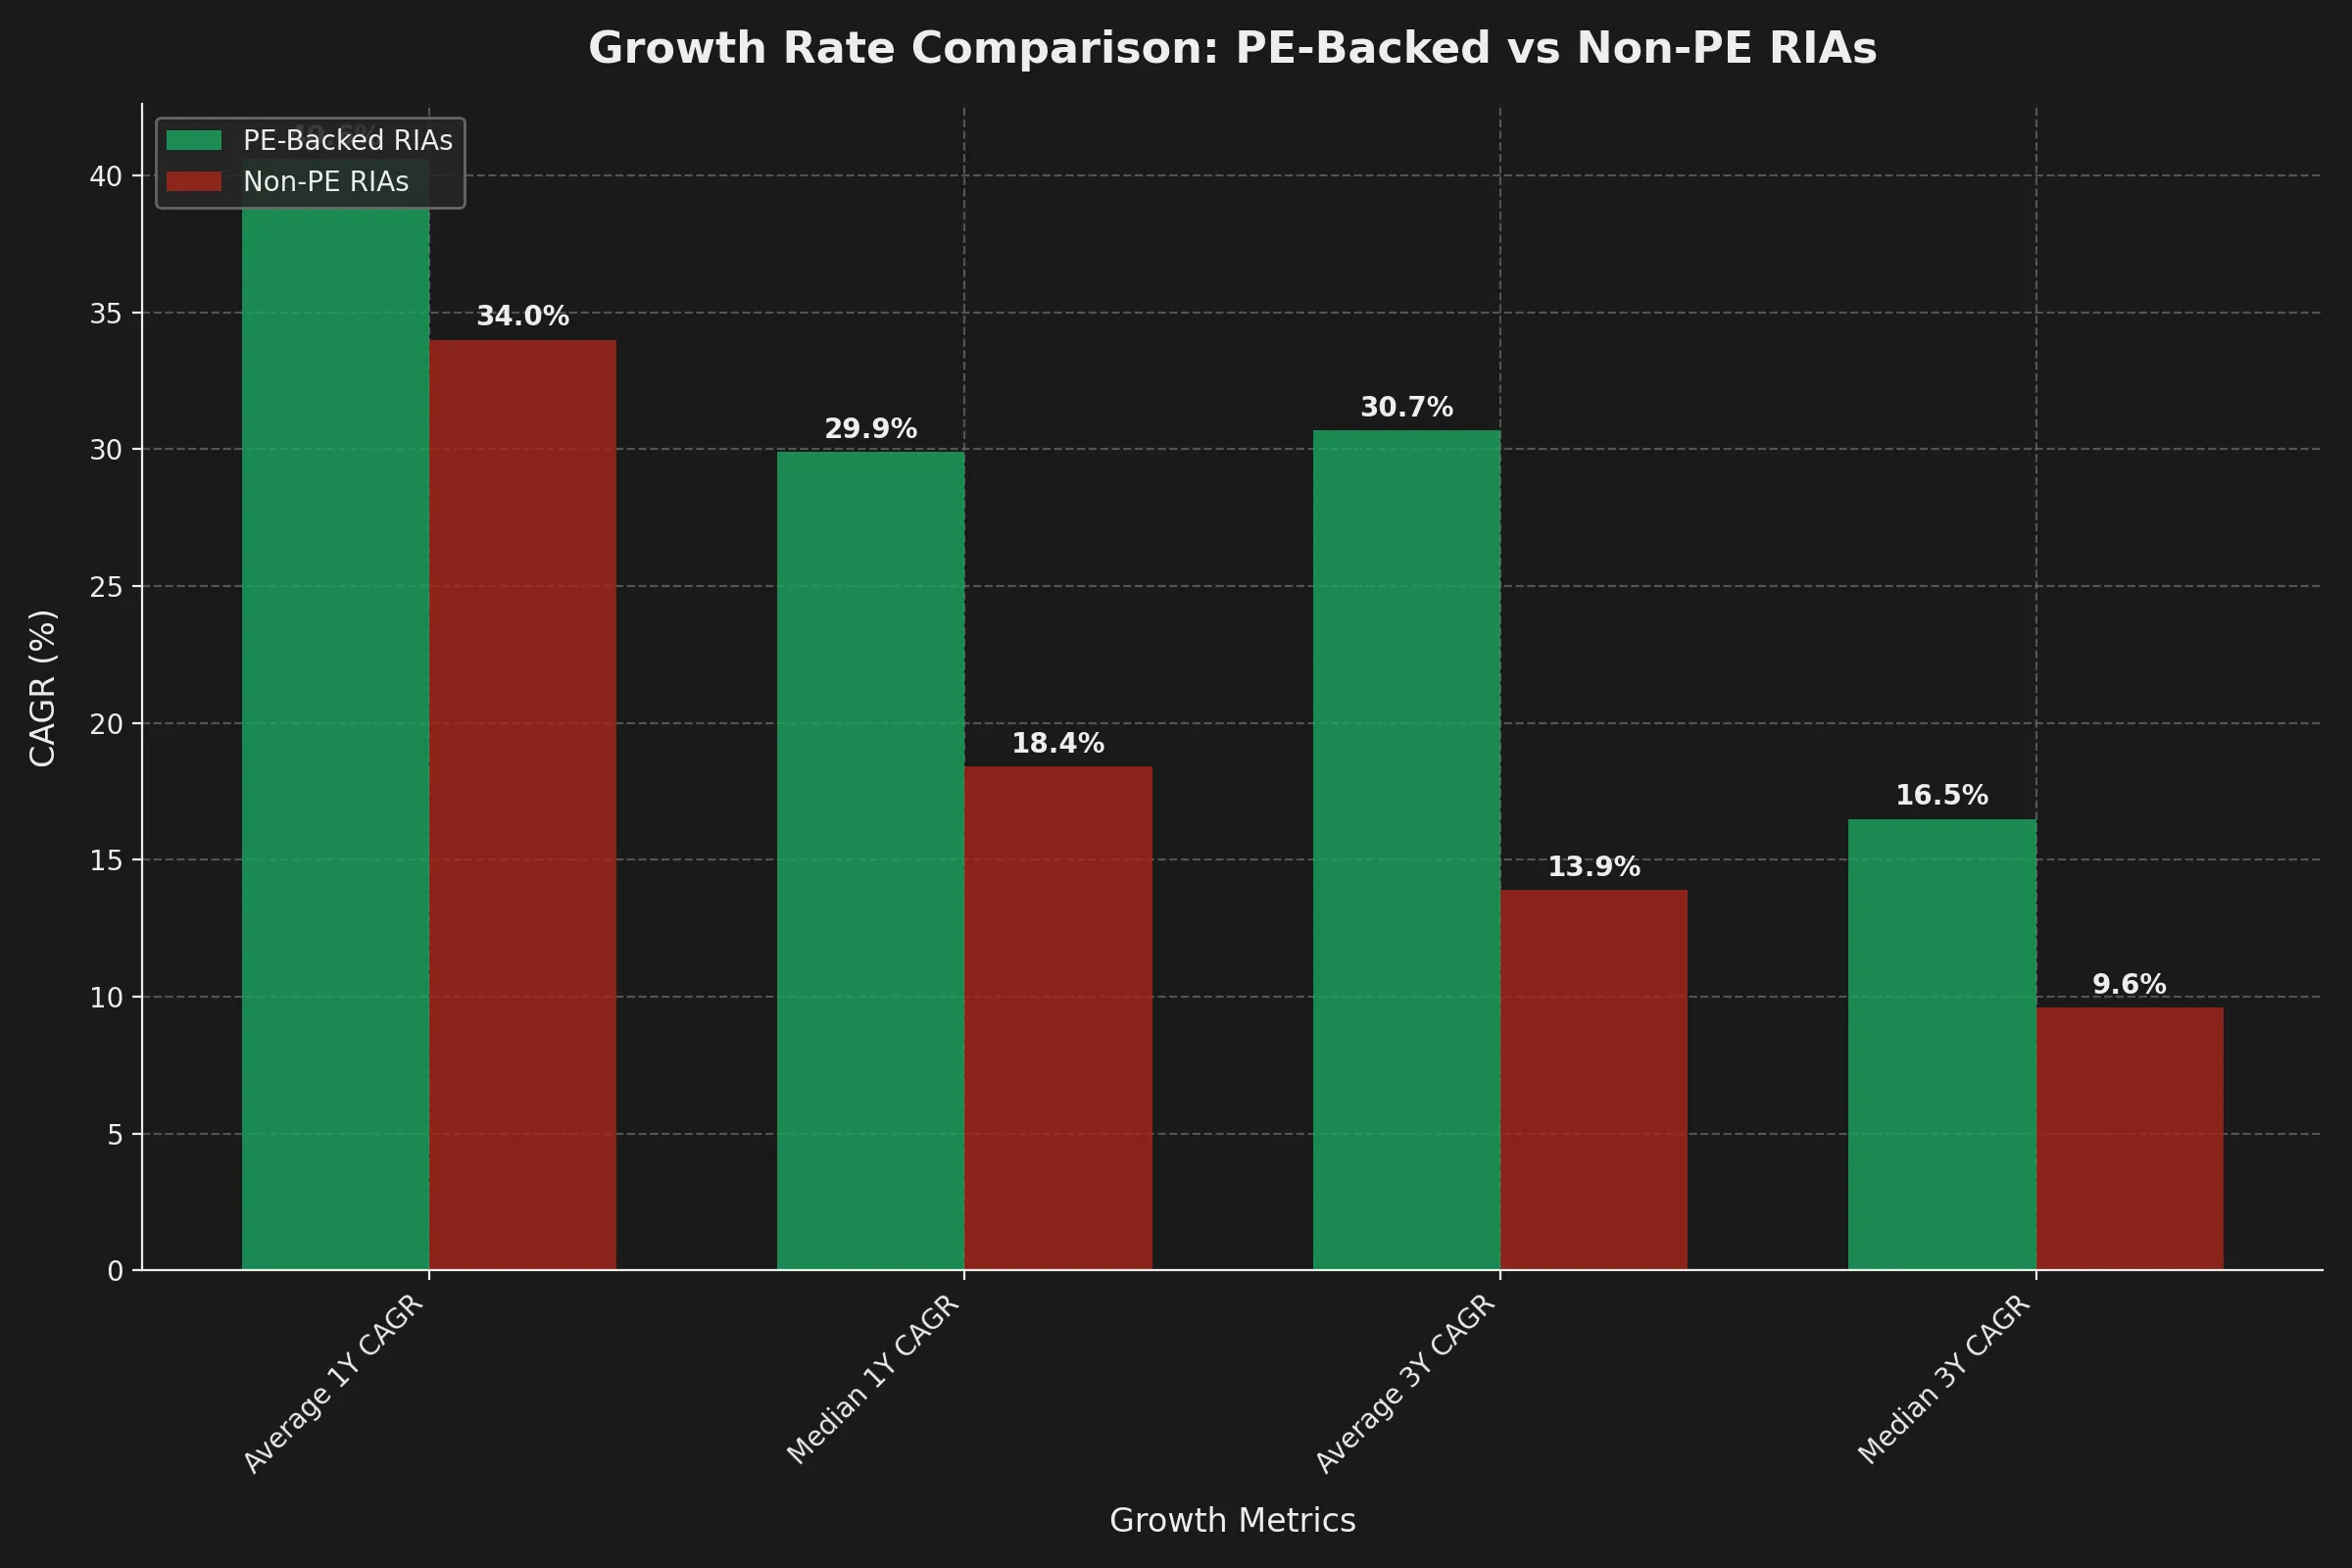
- PE-backed RIAs are growing faster than their peers: average 1Y CAGR of 40.6% vs. 34.0% for non-PE firms, and a 3Y CAGR of 30.7% vs. 13.9% for non-PE firms.
- Total AUM controlled by PE-owned RIAs climbed 14% to nearly $6.0 trillion, representing 22.96% of all $100M+ RIA assets.
- Median AUM for PE-backed RIAs decreased slightly, down to $2.31B from $2.45B, suggesting incremental growth in mid-sized and sub-$1B platforms.
- 81 RIAs under $1B AUM now report PE ownership, up from 62 a year earlier - an important trend in PE interest beyond mega-platforms. Many of these fall under PE-backed aggregators like Focus Financial.
- Despite accounting for only 3.7% of $100M+ RIA firms by count, PE owners now have ownership over nearly one-quarter of industry assets.
Introduction
The RIA market continues to consolidate, with private equity investors driving much of the change through platform investments and add-on acquisitions. While headlines often highlight multibillion-dollar platforms like Captrust (backed by GTCR and Carlyle), the data also show an accelerating wave of investment in smaller firms such as MN Wealth Advisors, a $330 million RIA backed by Trinity Hunt Partners.
AdvizorPro’s proprietary analysis of ADV filings provides a detailed view into this evolving ownership structure. By quantifying both RIA counts and AUM trends, we reveal how private equity is shaping the competitive dynamics of the advisory ecosystem.
Methodology
We analyzed SEC Form ADV Part 1 filings (Schedules A and B) for over 7,800 SEC-registered RIAs through mid-2025. Ownership records were reviewed for control by private equity sponsors. To isolate true investment advisory practices, we excluded firms registered as RIAs but operating solely as asset managers or non-advisory entities.
PE ownership penetration reflects the total number of RIAs reporting PE ownership as of July 1, 2024 and July 1, 2025, regardless of when the acquisition occurred.
It’s important to note that the count analysis reflects only those RIAs that continue to file a standalone Form ADV. When smaller firms are acquired and fully absorbed into existing PE-backed platforms, they no longer maintain a separate ADV filing and therefore are not counted directly in these totals. This means our figures capture the visible footprint of PE ownership, while the true level of consolidation—including tuck-ins and absorbed entities—is even greater.
Section 1: PE-Ownership Penetration (July 2024 vs. July 2025)
.webp)
¹ Based on an estimated $26 trillion in ADV filing RIAs with assets >$100M AUM.
Key Takeaway: PE’s share of industry assets continues to outpace its share of firms. With just 3.7% of firms, PE now controls nearly one-quarter of all $100M+ RIA assets. This growing concentration underscores the increasing importance of PE-backed platforms as competitive players.
Section 2: Firm Size & AUM Distribution
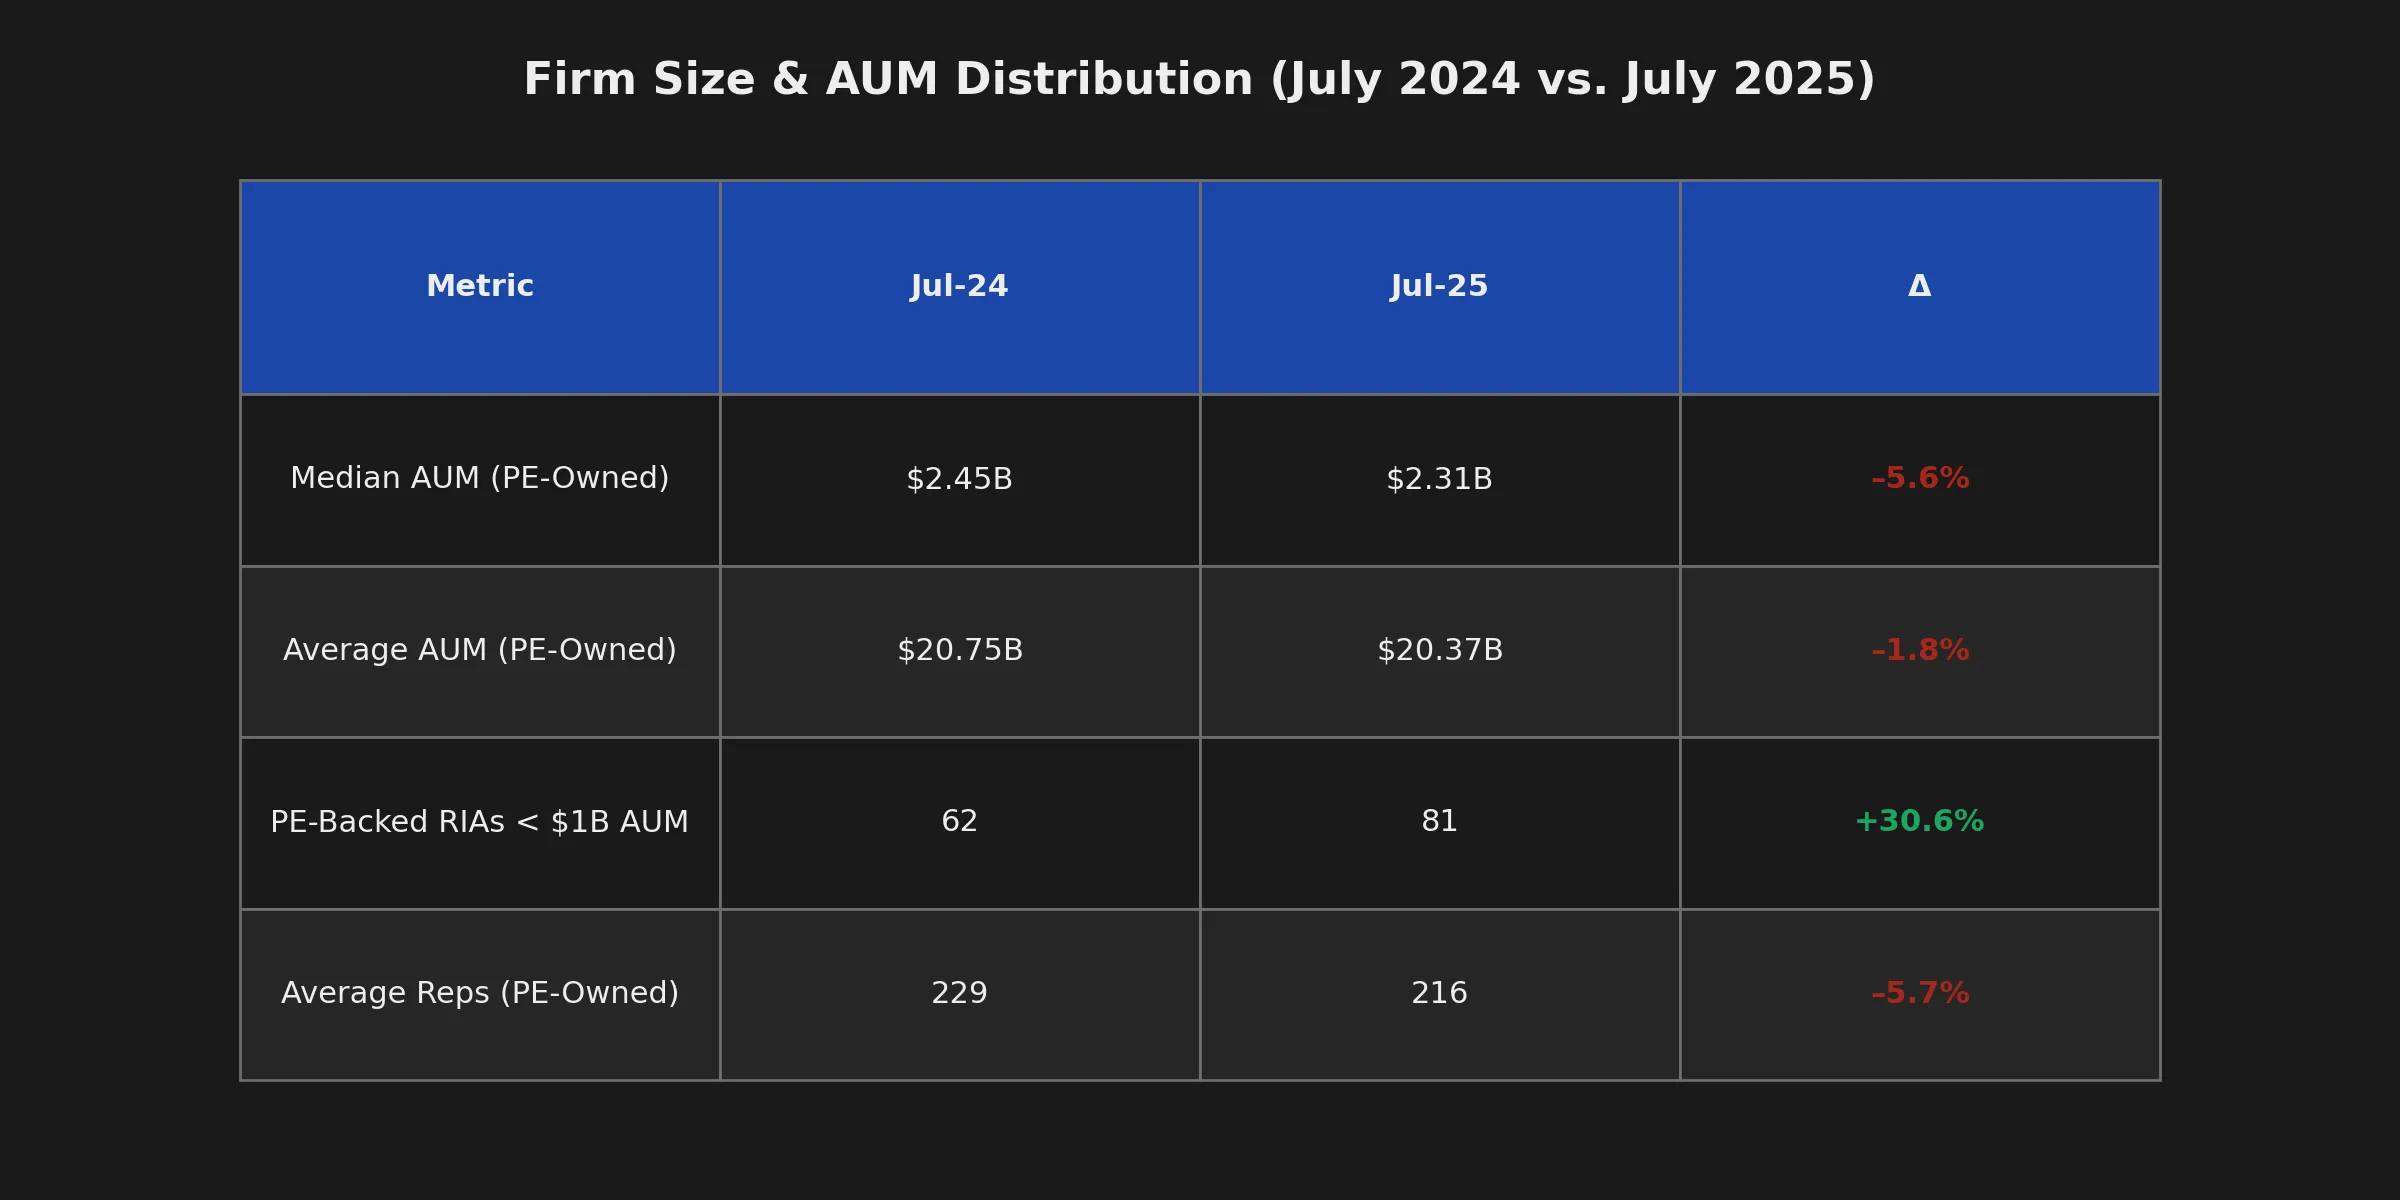
Insight: The decline in median AUM and the rise in sub-$1B firms suggests PE is increasingly active in the middle market. Sponsors appear to be broadening their scope beyond mega-platforms, seeking scalable regional firms that can be rolled up into larger strategies over time.
Section 3: Strategic Context
- Platform Concentration: Industry giants like Captrust continue to dominate headlines with AUM north of $1 trillion, highlighting PE’s ability to build multi-decade franchises.
- Middle-Market Expansion: The increase in <$1B PE-backed RIAs shows growing appetite for scalable platforms - a natural evolution as competition for mega-deals intensifies.
- Operational Efficiency: The decline in average representative headcount suggests firms may be running leaner, potentially reflecting technology adoption and efficiency gains in addition to focusing more on sub $1B RIAs.
Key Takeaway: Private equity’s strategy in the RIA sector is two-pronged: scale the largest platforms while also seeding future growth through mid-sized roll-ups. This dual approach supports both short-term asset aggregation and long-term market control.
Section 4: Growth Rates – PE vs. Non-PE RIAs
Beyond total AUM and firm counts, growth rates tell a clear story about how private equity ownership impacts the trajectory of RIA platforms. Our analysis compared 1-year and 3-year compound annual growth rates (CAGR) for PE-backed and non-PE-backed firms.

Key Takeaway
PE-backed RIAs are outpacing non-PE peers, posting higher growth rates both in the short term (1Y CAGR) and across multi-year horizons (3Y CAGR). This growth advantage compounds over time: with PE-backed firms already managing 23% of all RIA assets, their faster expansion means that share will only grow. Our analysis does not differentiate between organic and inorganic growth. One can assume inorganic growth is a key driver of this differentiation.
Private Equity is steadily capturing a larger slice of tomorrow’s AUM pie, reinforcing its long-term influence over the advisory ecosystem.
Conclusion
Private equity’s influence on the RIA market continues to accelerate, shaping how firms scale, consolidate, and compete for assets. As capital flows into both mega-platforms and emerging regional players, the data reveals a structural shift toward fewer, larger, and more strategically financed advisory organizations. This concentration of ownership is changing not only who leads the market, but how innovation and client service evolve across the industry.
To explore how private equity strategies are transforming advisor data ecosystems, read our overview on AI-Driven Intelligence in Wealth Management. For insights into how these consolidation trends are influencing real-time advisor activity, see the Advisor Movement Trends Report 2025.
Start your free trial to discover how AdvizorPro empowers you to understand and anticipate the forces reshaping the RIA landscape.

Written by: Cole Cummings
Cole Cummings is the Director of Marketing at AdvizorPro and a B2B SaaS marketer with multiple years of experience in the fintech industry. He leads all of AdvizorPro’s data-driven research and industry reports, giving him deep expertise in the RIA ecosystem and the trends shaping advisor behavior, allocation decisions, and firm growth across wealth management.
Related Post
Related insights you may find valuable